Manish Kumar

In the current neoliberal period,
public expenditure in various sectors is being reduced. The present government
is trying to implement a range of policies that run counter to the interests of
the people. One such measure is the proposal to remove the subsidy on kerosene.[1] This
proposal is purportedly based on data from the Census of India, 2011, which
indicates that only 3 per cent of all households in India are using kerosene as fuel
for cooking. It further points out that kerosene is a source of lighting for 31
per cent of all households. Basing itself on these figures, the Union
government has proposed to instruct all states to limit provision of subsidized
kerosene to un-electrified households. According to the proposal,
un-electrified households will be given a choice between cash subsidy for
kerosene and upfront subsidy for installing solar lighting systems. The
proposal also involves the directive that states with 100 per cent
electrification should move towards cleaner energy. The main objective behind
such policies is to decrease the fiscal burden. The impact such a measure would
have, however, does not end there. It would result in manifold problems even
apart from the widely discussed question of the shift to cash transfers [2], and
the deceptive formula of under-recovery for petroleum products.[3]
To understand the effect of such
policies, one needs to look at the sector and the people whom it is going to
effect. Kerosene is primarily used for two purposes, firstly as a fuel for
cooking and secondly, for lighting. Since in India consumption of kerosene is
largely found in households with low income levels, the policy to scrap subsidy
on kerosene is going to adversely affect these economically deprived sections.
Patterns of Energy-Usage in India
Fuels for Cooking:
In India, firewood, crop residue, cow
dung cake, coal, kerosene, LPG, electricity, biogas etc are major fuels for
cooking. According to census of India 2011, 49 per cent of total households use
firewood as primary fuel for cooking. Other than this, around 29 per cent
households use LPG, 9 per cent use crop residue, 8 per cent use cow dung cake,
1.5 per cent use coal and 3 per cent of total households use kerosene. So,
clearly around 66 per cent of total households in India use firewood combined with
crop residue and cow dung cake. The numbers presented here show the primary
fuel for cooking but most of the families use some secondary fuels as well from
the same available options. There can be many families which use Liquefied Petroleum
Gas (LPG) as well as kerosene or firewood and kerosene and so on. Whatever be
the combination, one thing is very clear that even after 67 years of
independence, most of the families are dependent on firewood, crop residue and
cow dung cake for cooking which is considered to be very dangerous for health
and for environment (world health organization report 2006).
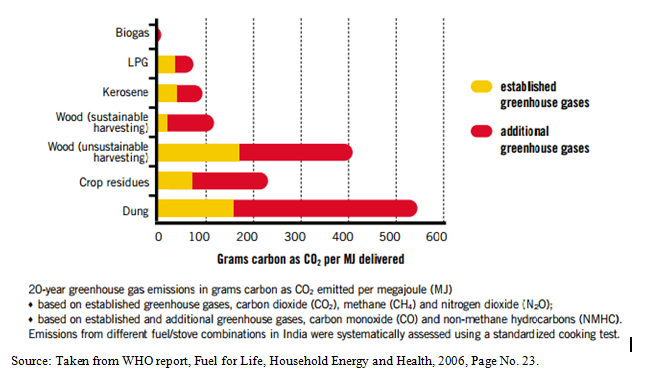
The first step toward clean energy must
be to discourage the use of firewood, crop residue and cow dung cakes.
Unfortunately India
has not improved in this much in last one decade. As per the census of India, 2001, 52
per cent of total households were using firewood and in the span of 10 years,
it could improve only by 3 per cent. The table 1, shown below gives
distribution of households based on type of fuels used for cooking. The states
like Rajasthan, Uttar Pradesh, Bihar, Nagaland, Tripura, Meghalaya, Assam,
Odisha, Chhattisgarh and Madhya Pradesh more than 75 per cent households are
using firewood, crop residue and cow dung cake (Table 1).Only three union territories
have less than 20 per cent households which are using these dangerous fuels. It
is also reflected in the data that the states or union territories which use
cleaner energy i.e. LPG have also more kerosene user families than the national
average. Clearly, kerosene’s role can’t be denied as a step in transition from
unclean to clean energy.
The reasons behind the large scale use
of firewood, cow dung cake or crop residue is the easier and cheaper
availability of these fuels. Other things like lack of awareness and lower
income level of households also play a great role in the usage of these
sources [4]. Obviously, awareness in this regard has to play a big role but at the same time
making cleaner and cheaper options available and accessible will help to a
great extent.
Table
1: Distribution of households by type of fuel used for cooking
1: Distribution of households by type of fuel used for cooking
|
States/Uts
|
Firewood (%)
|
Crop residue (%)
|
Cow dung cake (%)
|
Coal (%)
|
Kerosene (%)
|
LPG (%)
|
Electricity (%)
|
Biogas (%)
|
Any other (%)
|
No cooking (%)
|
|
Jammu and Kashmir
|
58.9
|
2.5
|
4.2
|
0
|
1.3
|
31.6
|
0.4
|
0.8
|
0.2
|
0.2
|
|
Himachal Pradesh
|
57.5
|
1.1
|
0.2
|
0
|
2.1
|
38.6
|
0.2
|
0.1
|
0
|
0.3
|
|
Punjab
|
13.4
|
6.5
|
20.4
|
0.2
|
3.2
|
54.5
|
0
|
1.4
|
0.1
|
0.3
|
|
Chandhigarh
|
4.6
|
0.3
|
0.2
|
0.1
|
21.9
|
71.6
|
0
|
0.1
|
0.1
|
1.1
|
|
Uttrakhand
|
48.7
|
1.3
|
3.2
|
0.1
|
1.8
|
44.2
|
0
|
0.5
|
0
|
0.3
|
|
Haryana
|
26.1
|
14.1
|
14.2
|
0.1
|
1
|
44
|
0
|
0.3
|
0.1
|
0.2
|
|
NCT Delhi
|
3.4
|
0.3
|
0.6
|
0.1
|
5.3
|
89.9
|
0
|
0.1
|
0.1
|
0.3
|
|
Rajasthan
|
61.8
|
11
|
3
|
0.1
|
0.9
|
22.8
|
0
|
0.1
|
0.1
|
0.2
|
|
Uttar Pradesh
|
47.7
|
8.7
|
23.1
|
0.3
|
0.7
|
18.9
|
0.1
|
0.2
|
0.1
|
0.2
|
|
Bihar
|
34.7
|
32.5
|
21.7
|
1
|
0.3
|
8.1
|
0.1
|
0.3
|
1.2
|
0.2
|
|
Sikkim
|
52.5
|
0.6
|
0.2
|
0.1
|
4.4
|
41.3
|
0.3
|
0.1
|
0
|
0.6
|
|
Arunachal Pradesh
|
68.7
|
0.7
|
0.1
|
0
|
0.7
|
29.2
|
0.1
|
0.1
|
0.1
|
0.3
|
|
Nagaland
|
77.9
|
0.8
|
0.1
|
0
|
0.6
|
20
|
0.1
|
0.1
|
0.1
|
0.2
|
|
Manipur
|
65.7
|
1.1
|
0.2
|
2.1
|
0.2
|
29.7
|
0.1
|
0.2
|
0.6
|
0.1
|
|
Mizoram
|
44.5
|
0.3
|
0.1
|
0.4
|
1.8
|
52.6
|
0.2
|
0.1
|
0.1
|
0.1
|
|
Tripura
|
80.5
|
0.8
|
0.1
|
0.1
|
0.6
|
17.6
|
0
|
0.1
|
0.1
|
0.1
|
|
Meghalaya
|
79
|
0.9
|
0.3
|
2.3
|
3.7
|
11.9
|
1.6
|
0.2
|
0.1
|
0.2
|
|
Assam
|
72.1
|
6.4
|
0.9
|
0.1
|
0.6
|
19
|
0.1
|
0.1
|
0.4
|
0.4
|
|
West Bengal
|
33.1
|
25.6
|
10
|
7.9
|
2.1
|
18
|
0.1
|
0.3
|
2.7
|
0.3
|
|
Jharkhand
|
57.6
|
4
|
7.2
|
18.1
|
0.2
|
11.7
|
0.3
|
0.1
|
0.6
|
0.1
|
|
Odisha
|
65
|
10.2
|
9.4
|
1.6
|
1.1
|
9.8
|
0.4
|
0.2
|
2
|
0.3
|
|
Chhattisgarh
|
80.8
|
0.9
|
3.7
|
2.3
|
0.5
|
11.2
|
0.1
|
0.2
|
0.1
|
0.2
|
|
Madhya Pradesh
|
66.4
|
5.6
|
7.7
|
0.2
|
1.3
|
18.2
|
0.1
|
0.4
|
0.1
|
0.2
|
|
Gujarat
|
44
|
5.7
|
2.6
|
0.5
|
7.6
|
38.3
|
0
|
0.9
|
0.1
|
0.4
|
|
Daman & Diu
|
10.8
|
1.5
|
0.2
|
0.2
|
30.8
|
53
|
0.1
|
0.9
|
0.1
|
2.4
|
|
Dadar & N H
|
40.4
|
0.4
|
0.2
|
0.1
|
17.8
|
39.8
|
0
|
0.4
|
0
|
0.8
|
|
Maharashtra
|
42.6
|
4.5
|
1.2
|
0.2
|
6.5
|
43.4
|
0.1
|
0.7
|
0.1
|
0.8
|
|
Andhra Pradesh
|
56.8
|
1.4
|
0.6
|
0.3
|
3.9
|
35.8
|
0.1
|
0.7
|
0.1
|
0.3
|
|
Karnataka
|
57.5
|
2.9
|
0.2
|
0.1
|
5.4
|
32.5
|
0.1
|
0.9
|
0.1
|
0.3
|
|
Goa
|
20.7
|
0.9
|
0.2
|
0.1
|
4.1
|
72.7
|
0.1
|
0.4
|
0.1
|
0.7
|
|
Lakshwadeep
|
54.8
|
10.7
|
0.1
|
0.1
|
13.7
|
16.6
|
1.2
|
0.2
|
0
|
2.5
|
|
Kerala
|
61.9
|
0.8
|
0.1
|
0.1
|
0.4
|
35.8
|
0
|
0.6
|
0
|
0.3
|
|
Tamil Nadu
|
43.5
|
0.6
|
0.2
|
0.1
|
6.9
|
47.9
|
0.1
|
0.3
|
0.1
|
0.4
|
|
Puducherry
|
18
|
0.3
|
0.1
|
0
|
10.3
|
70.5
|
0.1
|
0.1
|
0
|
0.6
|
|
A&N Island
|
33.8
|
0.4
|
0
|
0
|
19.8
|
44.5
|
0
|
0
|
0.1
|
1.4
|
|
India
|
49
|
8.9
|
8
|
1.5
|
2.9
|
28.6
|
0.1
|
0.4
|
0.5
|
0.3
|
Source:
Census of India,
2011.
Census of India,
2011.
The proposed policy in no way going to
help in discouraging the use of dangerous fuels, in fact it may lead to
increase in use of firewood, crop residue
and cow dung cakes. One can possibly argue, since only 3 per cent
households are using kerosene, so at max, use of dangerous fuel will increase
by 3 per cent. But here one should note
that to reduce the uses of dangerous fuels by just 3 per cent, country took 10
years and secondly, these data are only for primary fuel and not for secondary.
Suppose a rural household uses LPG as primary fuel and kerosene as secondary
then considering easy accessibility of firewood etc. the family will move
toward dangerous fuels because of higher price of kerosene. So the point is,
increase in price of kerosene will not only discourage it as a primary fuel but
also as a secondary fuel or in other words it will promote the use of firewood,
cow dung cake or crop residue indirectly.
Sources of Lighting:
In this proposal, electrification has
been taken as a parameter to take away subsidy from consumers. Now in the light
of this policy we need to understand the whole electrification process. As far
as question of 100 per cent electrification is concerned, it should be seen in
two parts i.e. urban electrification and rural electrification. If we consider
just electrification the urban India
is completely electrified. So, 100 per cent electrification of a state depends
only on rural electrification. Here one should note that definition of
electrification in general and village electrification in particular has
changed at many points of time. Before 1997, a village was considered as
electrified if electricity was used for any purpose. After 1997, to be called
an electrified village, electricity had to be used in any inhabited locality.
But Since 2004-05, Ministry of Power is using a three point definition i.e.[5]
“A
village would be declared as electrified if
village would be declared as electrified if
- Basic
infrastructure such as Distribution Transformer and Distribution lines are
provided in the inhabited locality as well as the Dalit Basti/ hamlet
where it exists. (For electrification through Non Conventional Energy
Sources a Distribution transformer may not be necessary). - Electricity
is provided to public places like Schools, Panchayat Office, Health
Centres, Dispensaries, Community centers etc. and - The
number of households electrified should be at least 10% of the total
number of households in the village.”
On the basis of the above definition,
Central Electricity Authority (CEA), Ministry of Power (MoP) gives the
following figures (Aug, 2014).
Central Electricity Authority (CEA), Ministry of Power (MoP) gives the
following figures (Aug, 2014).
At the
first sight, the table 2, shown below represents an impressive image of rural India. Except
for a few states, more than 90 per cent villages of Indian states are
electrified.
first sight, the table 2, shown below represents an impressive image of rural India. Except
for a few states, more than 90 per cent villages of Indian states are
electrified.
Table 2
Distribution of state wise electrified villages
Distribution of state wise electrified villages
|
States/UTs
|
Total
Inhabited Villages |
Electrified
villages, achievement as on 31-08-14 |
Proportion
of electrified village (%) |
|
Andhra Pradesh
|
26286
|
26286
|
100
|
|
Arunachal Pradesh
|
5258
|
3614
|
68.7
|
|
Assam
|
25372
|
24548
|
96.8
|
|
Bihar
|
39073
|
37316
|
95.5
|
|
Chhattisgarh
|
19567
|
19092
|
97.6
|
|
Goa
|
320
|
320
|
100
|
|
Gujarat
|
17843
|
17843
|
100
|
|
Haryana
|
6642
|
6642
|
100
|
|
Himachal Pradesh
|
17882
|
17880
|
99.99
|
|
Jammu & Kashmir
|
6337
|
6224
|
98.2
|
|
Jharkhand
|
29492
|
27167
|
92.1
|
|
Karnataka
|
27397
|
26704
|
97.5
|
|
Kerala
|
1017
|
1017
|
100
|
|
Madhya Pradesh
|
51929
|
50440
|
97.1
|
|
Maharashtra
|
40956
|
40920
|
99.9
|
|
Manipur
|
2379
|
2061
|
86.6
|
|
Meghalaya
|
6459
|
5152
|
79.8
|
|
Mizoram
|
704
|
600
|
85.2
|
|
Nagaland
|
1400
|
1261
|
90.1
|
|
Odisha
|
47677
|
38921
|
81.6
|
|
Punjab
|
12168
|
12168
|
100
|
|
Rajasthan
|
43264
|
39045
|
90.2
|
|
Sikkim
|
425
|
425
|
100
|
|
Tamil Nadu
|
15049
|
15049
|
100
|
|
Tripura
|
863
|
837
|
97
|
|
Uttar Pradesh
|
97813
|
96515
|
98.7
|
|
Uttarakhand
|
15745
|
15638
|
99.3
|
|
West Bengal
|
37463
|
37461
|
99.99
|
|
A & N Island
|
396
|
308
|
77.8
|
|
Chandigarh
|
5
|
5
|
100
|
|
D & N Haveli
|
65
|
65
|
100
|
|
Daman & Diu
|
19
|
19
|
100
|
|
Delhi
|
103
|
103
|
100
|
|
Lakshadweep
|
6
|
6
|
100
|
|
Pondicherry
|
90
|
90
|
100
|
|
Total
|
597464
|
571742
|
95.7
|
Source: Central Electricity Authority (http://www.cea.nic.in/reports/monthly/dpd_div_rep/village_electrification.pdf)
As the definition in itself is very
clear that all households in an electrified village need not to be electrified
and that is why we can see a huge gap between village electrification and
household electrification across the states. As per the census of India, 2011
only 67 per cent of total households are electrified. For urban and rural parts
these are 93 per cent and 55 per cent respectively.
It is beyond any doubt that
electrification and particularly rural electrification is necessary for
economic betterment as well as for social betterment. With
this view several projects started by the central government at different
points of time to promote rural electrification, such as the Kutir Jyoti
Yojana: 1988, Pradhan Mantri Gramodaya Yojana: 2000-01, Accelerated Rural
Electrification Program: 2003-04 and the Rajiv Gandhi Grameen Vidyutikaran
Yojana (RGGVY): 2005, which was
committed to electrify all rural households by 2012. But the real achievements
of the nation are far below than expected.
Table 3 gives state wise
distribution of electrified households in rural as well as in urban areas. Still
a dozen states could not provide electricity to their more than 40 per cent of
total rural households. In six out of these twelve states, more than 50 per
cent rural households are un-electrified. Bihar is the worst in India. Only 10
per cent rural households are electrified in the state. Given the condition of electrification,
limited options are available for lighting, kerosene is one of those. According
to census of India,
2011, kerosene is used as source of lighting in more than 31 per cent
households. For rural part it is around 43 per cent and in urban areas it is
6.5 per cent. Use of solar energy is negligible for lighting purposes. Only 0.4
per cent of total households in India
use solar energy. So, un-electrified households have to completely rely of
kerosene for lighting.
Table3. State-wise distribution of electrified households (Rural and Urban)
|
States/UTs
|
Proportion of
electrified Households |
||
|
All
|
Rural
|
Urban
|
|
|
Jammu and Kashmir
|
85.1
|
80.7
|
98
|
|
Himachal Pradesh
|
96.8
|
96.6
|
98.1
|
|
Punjab
|
96.6
|
95.5
|
98.3
|
|
Chandhigarh
|
98.4
|
97.3
|
98.4
|
|
Uttrakhand
|
87
|
83.1
|
96.5
|
|
Haryana
|
90.5
|
87.2
|
96.2
|
|
NCT Delhi
|
99.1
|
97.8
|
99.1
|
|
Rajasthan
|
67
|
58.3
|
93.9
|
|
Uttar Pradesh
|
36.8
|
23.8
|
81.4
|
|
Bihar
|
16.4
|
10.4
|
66.4
|
|
Sikkim
|
92.5
|
90.2
|
98.7
|
|
Arunachal Pradesh
|
65.7
|
55.5
|
96
|
|
Nagaland
|
81.6
|
75.2
|
97.4
|
|
Manipur
|
68.3
|
61.2
|
82.4
|
|
Mizoram
|
84.2
|
68.8
|
98.1
|
|
Tripura
|
68.4
|
59.5
|
91.6
|
|
Meghalaya
|
60.9
|
51.6
|
94.9
|
|
Assam
|
37
|
28.4
|
84.1
|
|
West Bengal
|
54.5
|
40.3
|
85.1
|
|
Jharkhand
|
45.8
|
32.3
|
88
|
|
Odisha
|
43
|
35.6
|
83.1
|
|
Chhattisgarh
|
75.3
|
70
|
93.7
|
|
Madhya Pradesh
|
67.1
|
58.3
|
92.7
|
|
Gujarat
|
90.4
|
85
|
97.2
|
|
Daman & Diu
|
99.1
|
98.3
|
99.3
|
|
Dadar & Nagar
Haweli |
95.2
|
91.7
|
98.5
|
|
Maharashtra
|
83.9
|
73.8
|
96.2
|
|
Andhra Pradesh
|
92.2
|
89.7
|
97.3
|
|
Karnataka
|
90.6
|
86.7
|
96.4
|
|
Goa
|
96.9
|
95.6
|
97.7
|
|
Lakshadweep
|
99.7
|
99.8
|
99.7
|
|
Kerala
|
94.4
|
92.1
|
97
|
|
Tamil Nadu
|
93.4
|
90.8
|
96.1
|
|
Puducherry
|
97.7
|
95.8
|
98.5
|
|
A&N Island
|
86.1
|
79.4
|
97.7
|
|
INDIA
|
67.2
|
55.3
|
92.7
|
Source: Census of India, 2011
When large part of India is still
far away from electricity in such a condition the proposed policy can adversely
affect already deprived sections. These households
are not using kerosene by choice. They are forced to use it as no alternative is
available. Secondly, social and economic backwardness affects the process of
electrification in an electrified village, so expensive kerosene can leave them
in darkness [6]. One can possibly argue that
government is proposing to give cash subsidy or upfront subsidy for solar
lighting system so there is no such harm. But one should note that there is a
provision in RGGVY i.e. Decentralized Distributed Generation (DDG) and Supply.
This makes the arrangement for decentralized generation cum distribution from
other sources where grid connectivity is either not feasible or not cost
effective. Data on village electrification already incorporates such villages.
Even after having such provisions still many houses are un-electrified. There
is no doubt that promoting solar energy is good but feasibility of this is
questionable.
Moreover, even if any house
is electrified, inadequacy of electricity supply is very serious issue. The table
4, shown below gives state wise deficit of electricity during peak hours
(period between 1800 hrs to 2300 hrs is considered as peak hour). There is a
deficit of 6103 MW at all India
level. The point to be noted is this condition is when many parts of the
country are still not connected with electricity. Therefore the overall demands
mentioned here do not include demand by the un-electrified parts. It is anyone’s
guess that the real deficit would be even higher when all the households are
electrified.
Table 4 State wise peak
hour deficit during 2013-14
hour deficit during 2013-14
|
Region / State /
System |
Peak Demand (MW)
|
Peak Demand
Met(MW) |
Deficit/Surplus
|
Deficit/Surplus
(%) |
|
Chandigarh
|
345
|
345
|
0
|
0
|
|
Delhi
|
6,035
|
5,653
|
-382
|
-6.3
|
|
Haryana
|
8,114
|
8,114
|
0
|
0
|
|
Himachal Pradesh
|
1,561
|
1,392
|
-169
|
-10.8
|
|
Jammu &
Kashmir |
2,500
|
1,998
|
-502
|
-20.1
|
|
Punjab
|
10,089
|
8,733
|
-1,356
|
-13.4
|
|
Rajasthan
|
10,047
|
10,038
|
-9
|
-0.1
|
|
Uttar Pradesh
|
13,089
|
12,327
|
-762
|
-5.8
|
|
Uttarakhand
|
1,826
|
1,826
|
0
|
0
|
|
Chhattisgarh
|
3,365
|
3,320
|
-45
|
-1.3
|
|
Gujarat
|
12,201
|
12,201
|
0
|
0
|
|
Madhya Pradesh
|
9,716
|
9,716
|
0
|
0
|
|
Maharashtra
|
19,276
|
17,621
|
-1,655
|
-8.6
|
|
Daman & Diu
|
322
|
297
|
-25
|
-7.8
|
|
Dadra & Nagar
Havel |
661
|
661
|
0
|
0
|
|
Goa
|
529
|
529
|
0
|
0
|
|
Andhra Pradesh
|
14,072
|
13,162
|
-910
|
-6.5
|
|
Karnataka
|
9,940
|
9,223
|
-717
|
-7.2
|
|
Kerala
|
3,671
|
3,573
|
-98
|
-2.7
|
|
Tamil Nadu
|
13,522
|
12,492
|
-1,030
|
-7.6
|
|
Puducherry
|
351
|
333
|
-18
|
-5.1
|
|
Lakshadweep
|
9
|
9
|
0
|
0
|
|
Bihar
|
2,465
|
2,312
|
-153
|
-6.2
|
|
Jharkhand
|
1,111
|
1,069
|
-42
|
-3.8
|
|
Odisha
|
3,727
|
3,722
|
-5
|
-0.1
|
|
West Bengal
|
7,325
|
7,294
|
-31
|
-0.4
|
|
Sikkim
|
90
|
90
|
0
|
0
|
|
Andaman &
Nicobar |
40
|
32
|
-8
|
-20
|
|
Arunachal Pradesh
|
125
|
124
|
-1
|
-0.8
|
|
Assam
|
1,329
|
1,220
|
-109
|
-8.2
|
|
Manipur
|
134
|
133
|
-1
|
-0.7
|
|
Meghalaya
|
343
|
330
|
-13
|
-3.8
|
|
Mizoram
|
84
|
82
|
-2
|
-2.4
|
|
Nagaland
|
109
|
106
|
-3
|
-2.8
|
|
Tripura
|
254
|
250
|
-4
|
-1.6
|
|
All India
|
135,918
|
129,815
|
-6,103
|
-4.5
|
Source: Load generation
balanced report 2014-15, MoP. 2014
balanced report 2014-15, MoP. 2014
Conclusion
Analysis of proposed policy
suggests that it is going to adversely affect deprived people. At one hand it
can promote more use of firewood, crop residue and cow dung cakes as fuel for
cooking. At another hand the proposed policy can snatch lamp from households
without providing light to the bulb. Considering the current situation of the
nation priority should be given to discourage the use of firewood, crop residue
and cow dung cakes and this will be more difficult once the subsidy on kerosene
is scrapped. Instead, intensive electrification, more generation and adequate
supply of electricity can automatically discourage the use of kerosene as
source of lighting.
References
Other Important articles
2. http://www.thehindu.com/news/national/keep-kerosene-subsidy-cpi/article6666646.ece?ref=relatedNews
Research Scholar at Centre for Economic Studies and Planning, JNU
Author is very thankful to Navpreet Kaur for her valuable suggestions and comments.