Abhay Kumar
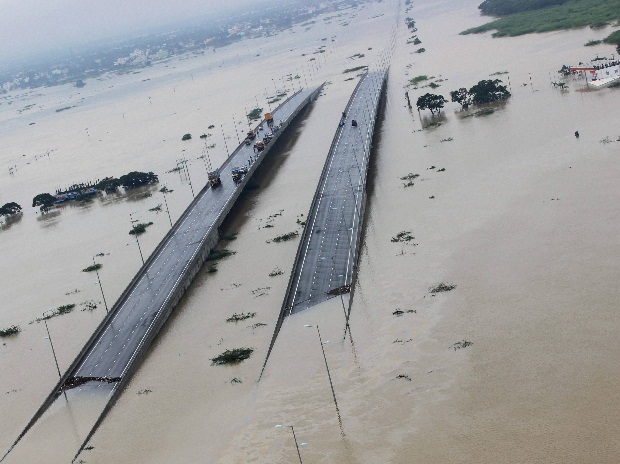
Chennai has been receiving a high
rainfall this year, which is unprecedented in the recent memory of the city. A more
or less similar situation exists in other parts of Tamil Nadu and Peninsular
India. In general, Peninsular India receives major rainfall during this time of
the year caused by the Northeast monsoon also known as retreating southwest
monsoon. Cool wind from Himalayas picks up moisture from the Bay of Bengal and causes
rain in the peninsular India during these four months from December to March.
What is unprecedented is the amount of rain that this region has already
received in a month when this amount of rainfall generally occurred over a
period of 3-4 months in this region. The grim situation can further be gauged
from the data given below (table 1 & 2).
have been increasing world over in the recent times mainly due to climate
change. A large number of human causalities in Tamil Nadu due to the rainfall
and floods is a grim reminder to the fact that we as a country and society
cannot afford to take issues of environment and climate change flippantly any
longer. A few years ago sudden flood caused by heavy rainfall in a very short
span of time and an overflowing moraine killed thousands in Uttarakhand. Kashmir witnessed a similar devastation last
year. Rampant destruction of wetlands, annihilation of rivers, over-burdened
storm drains in the cities have made it even more difficult to face such
disasters whenever they strike. Development without social equity and
environmental concerns will invariably end in such calamities for the people.
Such a paradigm for development is not sustainable at all. Urban planning must
factor in these issues to face such eventualities. A similar effort is required
in case of disaster response systems.
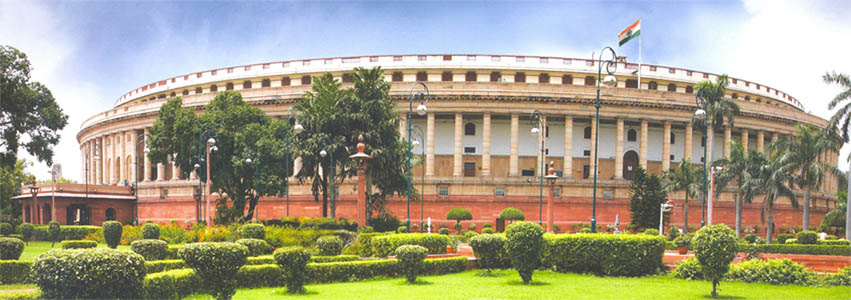
change in Paris presently. Decades have gone into addressing the issue without
a solution in sight. It’s a do or die situation now. The issue is not of reversing
the global warming. Enough fossil fuels have been burned. The average
temperature of the earth will rise and is rising. The issue is to prevent the average
temperature of the earth from increasing beyond 20 C. Which would
mean that the temperature of some parts of the world will rise by more than 20
C. By all indications India falls in such region. Whether or not Paris will
give world a legally binding treaty for reducing the emissions of green house
gases by the countries, the developing, economically less developed countries
and poor people will continue to face the brunt of the climate change in years
to come.
|
TEMPERATURE
Deg.
Cel. |
CHN
AP
|
CHN
|
RELATIVE
HUMIDITY
|
CHN
AP
|
CHN
|
RAINFALL
(mm)
|
CHN
AP
|
CHN
|
|
Max.
past 24 hrs. |
28.2
|
28.4
|
At 0830 hrs IST
|
96
|
95
|
Past 24
hours |
64.1
|
39.6
|
|
Dep.
from normal |
-1.1
|
-0.8
|
Dep. from normal
|
15
|
14
|
Since
01.10.15 |
1401.3
|
1248.8
|
|
Min.
past 24 hrs. |
21.9
|
24.0
|
at 1730
hrs IST on 30.11.15 |
93
|
92
|
Dep.
from normal |
765.1
|
547.7
|
|
Dep.
from normal |
-0.2
|
1.7
|
Dep. from normal
|
23
|
19
|
|||
|
At 0830 hrs. IST
|
25.0
|
26.0
|
http://www.imdchennai.gov.in/rdwr.htm
|
STATIONS
(TAMIL
NADU
AND PUDUCHERRY)
|
TEMPERATURE
Degree celsius
|
HUMIDITY
Percentage
|
RAINFALL
|
Weather remarks
|
||||||||
|
Maximum
|
Minimum
|
Millimeters
|
Centimetres
|
|||||||||
|
Past
24 hrs.
|
Dep.
from normal
|
Past
24 hrs.
|
Dep.
from
normal |
At 0830
hrs. |
Dep.
from normal |
Past
24 hrs.
|
Season’s
total from 01.10.15 |
Dep.
from normal |
Year’s
total from 01.01.15 |
Annual
normal |
||
|
ºC
|
ºC
|
ºC
|
ºC
|
%
|
%
|
mm
|
mm
|
mm
|
cm
|
cm
|
||
|
Chennai
|
28
|
-1
|
24
|
2
|
95
|
14
|
40
|
1249
|
548
|
168
|
140
|
r
|
|
Chennai AP
|
28
|
-1
|
22
|
0
|
96
|
15
|
64
|
1401
|
765
|
198
|
138
|
r
|
|
Coimbatore AP
|
29
|
-1
|
23
|
3
|
81
|
0
|
1
|
215
|
-51
|
66
|
59
|
m*d
|
|
Cuddalore
|
29
|
0
|
23
|
2
|
98
|
13
|
97
|
1071
|
441
|
148
|
134
|
r
|
|
Dharmapuri
|
27
|
-2
|
19
|
1
|
95
|
18
|
6
|
423
|
142
|
101
|
91
|
r
|
|
Kanyakumari
|
30
|
0
|
23
|
-1
|
92
|
19
|
3
|
503
|
204
|
97
|
75
|
r
|
|
Madurai AP
|
30
|
0
|
24
|
2
|
75
|
-4
|
tr
|
230
|
-122
|
101
|
85
|
d
|
|
Palayamkottai
|
31
|
-1
|
24
|
0
|
83
|
2
|
17
|
689
|
343
|
97
|
73
|
r
|
|
Pamban
|
29
|
0
|
25
|
0
|
87
|
6
|
tr
|
466
|
-5
|
94
|
91
|
d
|
|
Parangipettai
|
30
|
–
|
24
|
–
|
100
|
–
|
159
|
1476
|
793
|
193
|
139
|
r
|
|
Puducherry
|
29
|
-1
|
23
|
0
|
100
|
19
|
153
|
1032
|
385
|
161
|
134
|
r
|
|
Salem
|
30
|
-1
|
23
|
3
|
88
|
14
|
5
|
367
|
72
|
110
|
102
|
z*r
|
|
Thanjavur
|
29
|
-1
|
24
|
2
|
98
|
11
|
20
|
535
|
163
|
100
|
95
|
r
|
|
Tiruchirapalli AP
|
30
|
0
|
23
|
1
|
88
|
9
|
3
|
505
|
200
|
102
|
87
|
m*r
|
|
Tondi
|
31
|
1
|
25
|
2
|
84
|
1
|
2
|
492
|
115
|
108
|
88
|
d
|
|
Toothukudi
|
28
|
-2
|
25
|
2
|
94
|
13
|
1
|
631
|
279
|
89
|
63
|
d
|
|
Uthagamandalam
|
20
|
0
|
12
|
4
|
81
|
7
|
1
|
493
|
184
|
130
|
116
|
d
|
|
Vellore
|
28
|
-2
|
22
|
3
|
96
|
10
|
26
|
821
|
496
|
154
|
103
|
r
|
|
* Weather at 0830
hrs. IST. Other remarks refer to preceding 24 hrs. D- Dust-storm d-Drizzle f-Fog h-Hail l-Lightning m-Mist p-Shower r-rain s-Snow z-Haze t-Thunderstorm AP-Airport tr-Rainfall 0.1 to 0.4 mm Tr-Rainfall 0.01 to 0.49 cm SFD-Safdarjung. The plus sign is omitted when the departure are above normal. |
||||||||||||
http://www.imdchennai.gov.in/rdwr.htm
is Climate
the important concerns of the human society in 21st century. Scepticism
around the science of climate change has weakened in face of mounting evidences
in favour of climate change and its impacts such as global warming and
increased incidences of extreme weather events. As the science of climate
change and predictions based on it are becoming more and more certain, it is
imperative for the people in general to have a better understanding of the
issue so that the society is prepared to face its consequences and an informed
debate can at least be carried out.
us first look into the question, viz., what is climate? Climate refers to the
average weather pattern of a place over a long period of time, usually 30 or
more years. There is a difference between weather and climate. Weather refers
to conditions of atmosphere (temperature, humidity, pressure, rain, etc.) of a
place at a particular time. Climate, therefore, is considered as the sum total
of weather patterns of a place over a long period of time (~30 years).
climate as a system; climate has various components such as atmosphere,
hydrosphere (oceans, rivers, lakes, ponds, etc.), lithosphere (land surface),
cryosphere (ice-covered region) and biosphere (vegetation and other living
beings). These components interact with each other non-linearly. Each of these
interactions along with the external forcings on these components such as Sun’s
intensity, Earth’s rotation around the Sun and plate tectonics drive climate,
also causing climatic variations. Sun’s intensity, Earth’s orbit and plate
tectonics are some of the examples of natural forcings. There could be human
induced forcings too such as enhanced concentrations of greenhouse gases (GHGs)
in atmosphere. So, climate can also be considered as a function of complex
interactions between various components and various factors described above. A schematic
representation of these components and their interactions are illustrated in
the figure 1.
is Climate Change
we concerned about it? Climate change has been typically defined as a significant and lasting change in the
statistical distribution of weather patterns over periods ranging from decades
to millions of years. Whatever may be the reasons for climate change; natural
or anthropogenic, it is a change in average weather conditions, or in the
distribution of weather around the average conditions (i.e., more or fewer
extreme weather events). In the Earth’s history, climate has changed
several times. In the geological time scale of Earth’s past, one finds that the
Earth has either cooled off or heated up repeatedly.
impacts on Earth’s biosphere. A similar warming is happening now, which is a
cause for concern since it has been happening at a faster rate and caused by
human activities. It has far reaching consequences on energy scenario of the
world and on our ways of life.

climate system (bold), their processes and interactions (thin arrows) and some
aspects that may change (bold arrows). (Source: http://www.grida.no/climate/ipcc_tar/wg1/pdf/tar-01.pdf {accessed in December, 2012})
change being witnessed by us? There has been a constant rise in the sea level.
Sea level rises because of thermal expansion of sea-water due to climatic
warming and melting of ice. The global average surface temperature of the Earth
has almost steadily increased since 1970. The top 700 metres of ocean have
shown a marginal increase (0.30F)
in its temperature. The Greenland and Antarctic ice sheets have decreased in
mass and the Arctic sea ice has also declined in volume. Glaciers world over
have retreated. Figure 2 shows the data or satellite images of these evidences
(source: climate.nasa.gov).
climatic changes are human induced and not due to natural external forcings. The
Fourth Assessment Report of the Intergovernmental Panel on Climate Change
(IPCC), a body of scientists and experts formed by the United Nations,
concluded that there was a more than 90 percent probability that human
activities over the past 250 years have warmed our planet. Solar irradiance is
primarily responsible for Earth’s climate. Any change in Sun’s irradiance
accordingly influences Earth’s climate. It is believed that the last change in Earth’s
climate called Little Ice Age between 1650 to 1850 was triggered by the
decreased solar activity. However, the present climate change is not related to
solar activity as there has been no flare up in Sun’s activity since 1750 and
if it was indeed caused due to increase in solar irradiance then a uniform
increase in temperature in all layers of atmosphere would have been observed.
However, top layers of atmosphere show cooling while warming is observed only
in the lower layers of the atmosphere, caused by the greenhouse gases. Finally,
no climate model fits well unless greenhouse gases are taken into account.
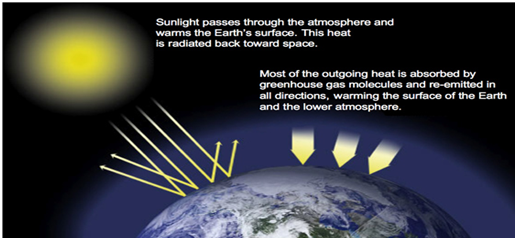
What is greenhouse effect? The Earth’s
average surface temperature is about 150C. Greenhouse gases, viz.,
CO2, Water vapour, CH4, N2O, CFCs, Ozone, etc,
present in the atmosphere act as blanket around the earth by trapping and
radiating back the escaping radiation, which is mostly in infrared region (IR,
having heating effects), from the earth’s surface. Had there been no GHGs in
atmosphere, the Earth’s surface would be frozen and the average surface
temperature would have been close to -140C. It is this warming of
the earth by the GHGs is termed as greenhouse effect. Figure 2 depicts the
greenhouse effect.
greenhouse effect in itself is not worrying. It is the enhanced concentration
of greenhouse gases in atmosphere that is causing global warming and thus
leading to climate change. Fig. 3 shows the graph pointing an increase of CO2
in atmosphere since Industrial revolution. The graph is based on data collected after
analysing atmospheric core samples and recent direct measurement of atmosphere
(climate.nasa.gov/evidence). Analysing ice core samples (of both ice layers and
trapped gases) provide a good peek into the past climate.
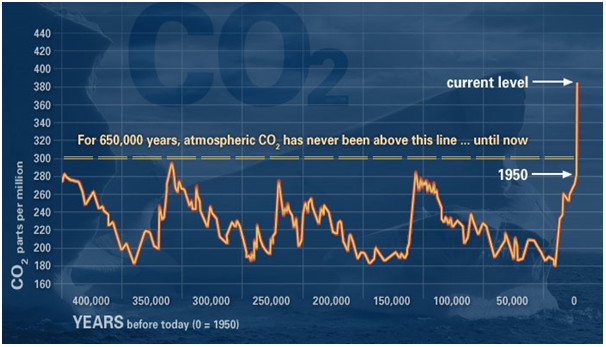
in atmosphere (ice core samples and direct measurement).
[climate.nasa.gov/evidence; accessed in December, 2013]
it should be remembered that there are other factors too (natural or human
induced), as discussed earlier, which may have positive or negative forcing on
climate. Each of these factors either may cause warming or cooling effect.
Scientists have used the term, radiative forcing to describe the process of
these interactions. A positive radiative forcing is when it leads to warming
while negative radiative forcing implies cooling. So, what would happen to
climate change would largely depend upon the final balancing between positive
and negative radiative forcings. There are still some uncertainties involved
especially in regard to the roles of aerosols (suspended particulate matter in
atmosphere). Aerosols absorb energy, aerosols reflect energy, aerosols as
nucleating agents help in the formation of precipitation. So, how and in what
ways it finally affects climate is still being debated.
are the greenhouse gases? As mentioned above, gases that contribute to the greenhouse effect
include:
Water
vapour: Water vapour is the most abundant greenhouse gas, which on the one hand
contributes in warming the earth and on the other hand warming will also mean
more water vapour in atmosphere thus leading to both increased precipitation
and more warming.
Carbon
dioxide (CO2): CO2is released through natural
processes such as respiration and volcano eruptions and through human
activities such as deforestation (chlorophyll in green plants in presence of
sun light fixes CO2; so cutting trees in a way help in building up
of CO2in atmosphere), land use changes, and burning fossil fuels.
Methane
(CH4): CH4 is less abundant than CO2and having
more potential than CO2 in causing climate change, is produced from
anoxic decomposition of wastes in landfills and guts of domestic livestock.
Nitrous
oxide (N2O): N2O is produced in biomass burning, fossil
fuel combustion and due to use of fertilisers.
Chlorofluorocarbons
(CFCs). CFCs are no longer in use after International Treaty (Montreal
Protocol) phased out its production due to its ability in destroying the ozone
layer. However, they are strong greenhouse gas.
comparative concentrations (preindustrial and current) of greenhouse gases
(GHGs) and their respective residence time in atmosphere.
gases (GHGs)
|
GHGs
|
Formula
|
Preindustrial concentration
|
Current Concentration
|
Atmospheric residence time (years)
|
|
Water vapour
|
H2O
|
1 to 4 %
|
1 to 4 %
|
1 Week
|
|
Carbon dioxide
|
CO2
|
280 ppm
|
379 ppm
|
50-200
|
|
Methane
|
CH4
|
715 ppb
|
1775 ppb
|
12
|
|
Nitrous oxide
|
N2O
|
270 ppb
|
319 ppb
|
114
|
|
Dichlorodifluoromethane (CFC-12)
|
CCl2F2
|
0
|
538 ppt
|
100
|
|
Chlorodifluoromethane(HCFC-22)
|
CHClF2
|
0
|
169 ppt
|
12
|
|
Carbon tetrafluoride
|
CF4
|
0
|
74 ppt
|
50000
|
|
Sulfur hexafluoride
|
SF6
|
0
|
5. 6 ppt
|
3200
|
annual greenhouse gas emissions by sectors. It is observed that if we take all
greenhouse gases into account then power stations contribute maximally in GHGs
emissions followed by industrial processes while waste disposal and treatment contributes
least. In case of carbon dioxide, a similar trend is observed while agriculture
sector contributes maximum in case of methane and nitrous oxide generation.

sector
of Climate Change
this article and that relates to the impacts of climate change. As the change
in climate is real, the impacts of it are also going to be real. Climate change
may result into a warmer and more humid climate. For a better understanding of
it, the impacts may be described sector-wise and region-wise. Climate change
has huge impacts on water, forest, agriculture, health, biodiversity, coastal
areas, etc. Global warming will increase the glacial melting. Initially, more
water will be available, which, however, will soon go deficient. Incidences of
floods will also increase. Sea level will rise, which will not only endanger
the low lying surrounding areas but will also affect the water quality as the
saline water intrudes into the freshwater zones of the land. As CO2
concentration in atmosphere increases, more and more CO2 will be
dissolved in oceans leading to its acidification (CO2 reacts with
water to form carbonic acid). This will have impacts on marine biodiversity. It
is believed that frequency of extreme weather events will also increase in
future. There will be a general loss in biodiversity as some species become
extinct unable to cope with the changing climate. A warm and humid climate will
mean a rise in malaria and other related tropical diseases. Energy scenario
especially in developing countries will remain bleak. Figure 6 depicts the
likely changes of climate change in different regions (source IPCC, 2001). All
these have bearing on socio-economic conditions of the countries. Developing
countries will be more stressed than the developed countries.
countries of the world to debate and decide on concrete measures to mitigate
the impacts of climate change. Unfortunately, the world has yet to see the
concrete measures. CO2 emission remains to be the bone of contention
as no country is willing to forego its rights to use fossil fuels given the
importance of fossil fuels at current juncture. So far 20 Conference of Parties
(CoP) have taken place. The 21st CoP is underway in Paris. Government
of India (GOI) too has formulated a National Action Plan for Climate Change
(NAPCC) with eight National Missions on “solar mission”, “enhanced energy
efficiency”, “sustainable habitat”, “water”, “sustaining the Himalayan
ecosystems”, “green India”, “sustainable agriculture“ and “strategic knowledge
for climate change” forming the “core of the NAPCC representing multi-pronged,
long term and integrated strategies for achieving key goals in the context of
climate change”. (http://pmindia.gov.in/climate_change_english.pdf).
Prime Minister of India chairs the advisory council providing guidelines to
NAPCC in the matters related to climate change. However,
situation remains grim and the peoples of the world have to rise as a
collective to face this challenge effectively.