Surajit Mazumdar

Since major measures started getting taken against the Coronavirus or Covid-19 threat in India, eventually leading to the nationwide lockdown from 25th March 2020, a fair amount of time has passed. About this period, three things can definitely be said:
.
a) There is more data available now than a month ago to construct a picture of how the disease is spreading and growing in India, its speed as well as pattern.
.
b) We could have had even more data if we had done more testing than was permitted by the conservative testing protocol pursued in India.
.
c) We know more, or at least should know more, about the actual, as opposed to anticipated, side-effects of the lockdown, particularly on economic activity.
.
All the above become relevant because what we are talking about is not a historical episode that has passed, but one we are still in the midst of. The data is relevant not just to analyse what happened in the unchangeable past, but importantly to influence positively the future, by helping identify the best way forward in the continuing battle against the Coronavirus. Given the dangers posed by the disease as well as the enormous social costs associated with measures like the lockdown, surely this cannot be considered a trivial concern. On the other hand, how successful we have been in containing the epidemic, and at what cost, depends also on what happens next – and will be settled only when the episode (or at least its current phase) is over.
.
However, we have heard little from those politically in charge of the nation and its battle against the epidemic, about the real policy options before the country that can be deduced from the trends so far. There has been no attempt to spell out where exactly do we stand today in a still unfolding story, or the likely public health and other implications of adopting one or the other course of action after 3 May. The Coronavirus is a stealthy enemy but surely there is no case for stealth and secrecy in the human response to it (which by the way makes the announcement of the lockdown in same manner as that of demonetization, with a few hours’ notice, utterly inexplicable). What is to be done is in the Government’s hands to decide but isn’t informed public discussion and debate to be encouraged to maximize the probability of the best decisions being taken?
.
Instead of the Government subjecting its measures to the widest possible critical scrutiny by making public all the relevant data, a certain selectivity and even deliberate manipulation has marked this process. A self-congratulatory attitude has often characterized the interpretations of the available data, particularly to emphasize the significance of the decision to impose a lockdown. Comparisons with the experience of other countries are touted out to bolster the claim of India having done exceptionally well in controlling the epidemic’s spread. The increase in the doubling time of confirmed cases of Coronavirus infection after the lockdown has also been highlighted as an important achievement, which has ensured that the growth in number of cases has been linear rather than exponential. The fact that India has relatively speaking managed to keep its numbers down, especially if one considers its large population, in turn provides a justification for the relatively low level of testing in India, supposedly establishing the redundancy of doing it on a much larger scale. What is highlighted is that in comparison with other countries, the percentage of positive cases of infection among all those tested is also low, indicating the limited spread in India. Recurrent references to the Nizamuddin Tablighi Jamaat congregation have been used to keep suggesting that the Indian picture would have been even better but for this one alleged act of irresponsibility. As to the scale of the damage to the economy and to livelihoods, no assessment has been put out officially let alone been integrated into the discussion on how the story is developing.
.
None of the ‘exceptional’ Indian record so far, however, has been used to explicitly assure the public that we are close to reaching the peak of this phase of the epidemic in India and one can expect the harsh restrictions to be eased soon. No possible time frame has been indicated in which the problem is likely to be eased. The past or the evidence it has thrown up is instead only used to send one message for the future – trust the government to do its job and just follow what it says unquestioningly and lay the blame, if any, on the shoulders of India’s hapless minorities. This, however, should not inspire trust or confidence about where we are heading to. Instead it should be a matter of great concern because honestly speaking, the ‘evidence’ presented so far does not definitely say much about what to expect going ahead.
.
Of the Growth in the Number of Confirmed Cases
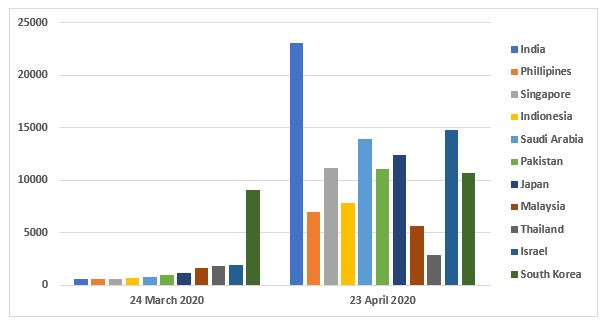
The considerably lower increase in number of confirmed cases in India in a fixed interval of time starting from when the same initial figure was attained in other countries does of course indicate that the spread of the infection is slower in India than in those chosen countries – which typically are the worst affected ones like the USA, Italy, Spain or UK, or Turkey in Asia. However, before arriving at any conclusions from this about the relative efficiency of Indian containment of the epidemic, it must be remembered that comparisons can go both ways. Figure 1 shows a comparison of the number of confirmed cases on 24th March and 23rd April 2020 for India and a number of her Asian counterparts with widely varying average income. All these countries were ahead of India in terms of number of cases at the time India’s lockdown began but have been left behind by India as it moved up the list to be now the country with the fourth largest number of confirmed cases in Asia. And there are several other countries from different continents which can be added to those shown here. In other words, the average rate of growth of cases during one of the most extreme lockdowns in the world has by no means been the least.
.
Figure 1: Number of Confirmed Coronavirus Cases on 24 March and 23 April 2020: Selected Countries
.
One may of course still point to the fact that relative to the size of the population, the number of cases in India remains extremely low. Yes, in comparison to all the other countries in Figure 1 this is true. Yet there are more than 40 countries in Africa, Asia and Central America where the incidence of Coronavirus infections as measured by the confirmed cases per million population is lower than in India. This includes India’s South Asian neighbours Nepal and Bhutan. The African continent as a whole, which has a population of 133 crores, just a little short of India’s, had about 28,000 confirmed cases on 23 March 2020 as compared to India’s 23,000 odd. What is the common characteristic India shares with all these countries or regions in whose populations the spread of the Coronavirus infection appears to be low so far? The possession of a high-quality and efficient administrative and public health system is certainly not what is likely to come to the minds of those who are attributing India’s success to these factors.
.
Indeed, there is yet another comparison, at first sight a surprising one, that can be made which shows up Indian figures currently to be not so low – that with China, or more precisely China other than the Hubei Province in which is located Wuhan city. China and India stand apart from all the other 200 plus countries that have been afflicted by the pandemic on account of the sheer sizes of their populations. Each individually is more populous than any continent other than Asia, and together they account for nearly 60 per cent of that continent’s total population too. There is, however, one important difference between these two in relation to the pandemic. China was the first country in the world which had to deal with the new virus, while India is among the last to be hit severely. India barely had a 100 odd cases of the infection in mid-March 2020, by which time the epidemic had almost run its course in China and the active cases had been in decline for a month. Between mid-February and mid-March, the number of infected people and deaths in the rest of the world other than China had had also grown from negligible levels to be on the verge of matching those in that country. Not only did Europe, North and South America, East and South East Asia excluding China and West Asia have more confirmed Coronavirus cases than India, so too did several individual countries in these continents and regions. among them had more confirmed cases than India. African countries were less affected but the continent as a whole already had many more cases than India.
.
China’s more adverse situation, however, reflected itself only in what happened in Hubei Province, where the epidemic originated. This province of less than 6 crores people accounted for the bulk of the numbers of infected people and deaths in China. These figures have been revised upward recently but in relation to the same province. If we look at the rest of China, a population almost the same as India’s, the number of confirmed cases has remained well below 15,000 and the deaths at less than 250. India, despite its latecomer advantage has crossed 23,000 confirmed cases and had over 700 deaths.
.
Of the Increase in Doubling Time
The doubling time of confirmed cases, or the number of days in which the confirmed cases double from an initial base figure, is a measure of the pace or rate at which the cumulative number of infected people multiply – the higher is the number of days taken for them to double, the slower is the increase in these numbers relative to their base level. It is true if you go by the data that the doubling time of cases in India as a whole has increased compared to what it was before the lockdown. In itself, however, a slowing down of the rate of transmission of the infection is not an exceptionally surprising thing but something one should expect during a lockdown. Even in countries with whom comparisons have been made, a similar thing has been observed. In China, Italy and Spain for instance, an increase in doubling time from week to week characterized their trajectory from when they had around 500 confirmed cases – and yet they went to over 80,000, 180,000 and 200,000 cases respectively.
.
Whether the number doubles in 3-4 days or in 9-10 days, it still doubles. Each doubling increases the base figure from which the next doubling happens, counteracting part of the effect of increase in doubling time. So, if the base number of confirmed cases is 500 (similar to the actual number on the eve of the nationwide lockdown) and the doubling time is 3.5 days, the number of confirmed cases would rise to 2000 in a week, or an increase of 1500 over the week. If, on the other hand, the base was 15000 while the doubling time is 7 days – 15000 new cases would get added in the same time of one week. The real question, therefore, is, can the increase in doubling time go on increasing as significantly as it has over the 30 days of the lockdown? It is far from obvious that such a further decline will happen because by now the rate of spread should be expected to reflect its propensity under lockdown conditions – as new confirmations would tend to be mainly of those infected during this period and not those infected earlier but tested and confirmed during the lockdown.
.
Now, if the doubling time continues to increase as it has, then a projection from the present would indicate that roughly by the end of May the increase in the cumulative number of cases should completely taper off after reaching a level of 65-70,000 cases and by mid-May the number of active cases would start coming down after reaching a peak level of 27-28,000. However, if the doubling time stabilizes at around 10 days, then by the end of the lockdown India would have some 46,000 odd cases, a base number many times larger than the one before the lockdown. Even if easing the lockdown doesn’t have any adverse effect on this doubling time, the base for further spread of the infection would be much larger than before the lockdown – by mid-May we would have more than a lakh cases and perhaps over 75000 active cases. Thus, there is a very wide range of future outcomes that can be projected from the past trends depending on what is assumed about the future course of the doubling time – all the more so because a second wave cannot be ruled out. Until one knows where within this large range the actual story is going to lie, it is impossible to say what the “flattening of the curve” in India achieved by the lockdown and other containment measures actually means – has the epidemic been supressed before it reaches a large part of the population or has the time taken to reach the maximum number been only lengthened. This is not only a matter of assessing what has been achieved but is important to determining what has to be done in the future. One assumption could lead to a conclusion that another two- or three-week extension of the lockdown would do the job of decisively stopping the virus in its tracks by limiting the number of people who would be infected in India. Another would indicate that it is going to be a long haul and since lockdown cannot be the chosen strategy for the longer term, other measures to keep the pace of growth of the infection down and building preparedness for dealing with the increasing number of cases requiring hospitalization have to
be built.
be built.
.
Of the Low Percentage of Positive Cases
The contention that the percentage of positive cases in India (the proportion of all people or samples tested in which the presence of the infection is confirmed) has been low, and remained so even as the number of tests have been increasing, is again a relative statement in which the countries one chooses to compare India with are important. Table 1 lists a number of countries with a testing scale (total tests conducted per million population) similar to or higher than India’s and a positive confirmation ratio up to or below 5, which is just above the Indian ratio. The list is further limited to countries with an incidence of confirmed cases per million population not exceeding 50.
.
Now, it can be seen that a number of countries do show low confirmation ratios even if we limit their numbers by putting the additional criteria relating to testing scale and incidence of the infection. Further, there are several countries where the scale of testing has been higher than that in India, and yet the measured incidence of the Coronavirus infection in their populations is lower. Since, other things remaining the same, the measured incidence in any country should be higher, the higher is the extent of testing (because you catch more of the infected people in the population), even countries with a higher measured incidence than India need not have a higher actual incidence.
.
Table 1: Incidence of Coronavirus infection, Testing Scale and Positive Confirmation Ratios, Selected Countries (as on 23.4.2020)
|
Country,
|
Total
Confirmed Cases Per Million Population |
Total
Tests per Million Population |
Positive
Test Ratio |
|
Nepal
|
2
|
301
|
0.5
|
|
Zimbabwe
|
2
|
336
|
0.6
|
|
Uganda
|
2
|
351
|
0.5
|
|
Vietnam
|
3
|
2119
|
0.1
|
|
Cambodia
|
7
|
345
|
2.1
|
|
Botswana
|
9
|
1885
|
0.5
|
|
Bhutan
|
9
|
11603
|
0.1
|
|
Venezuela
|
10
|
12211
|
0.1
|
|
Togo
|
11
|
572
|
1.9
|
|
Mongolia
|
11
|
2183
|
0.5
|
|
Rwanda
|
12
|
537
|
2.2
|
|
Sri Lanka
|
17
|
345
|
5.0
|
|
India
|
17
|
363
|
4.6
|
|
Suriname
|
17
|
689
|
2.5
|
|
Taiwan
|
18
|
2435
|
0.7
|
|
Guatemala
|
19
|
402
|
4.8
|
|
Guinea-Bissau
|
25
|
762
|
3.3
|
|
Eswatini
|
27
|
615
|
4.3
|
|
Paraguay
|
30
|
925
|
3.2
|
|
Ghana
|
37
|
2207
|
1.7
|
|
Egypt
|
38
|
879
|
4.3
|
|
El Salvador
|
39
|
2372
|
1.6
|
|
Thailand
|
41
|
2043
|
2.0
|
|
Iraq
|
42
|
1613
|
2.6
|
|
Jordan
|
43
|
3528
|
1.2
|
|
Belize
|
45
|
2052
|
2.2
|
.
How the extent of testing moves over time is also relevant to the comparisons made across countries in the rate of growth of the infected people and therefore of the measured change in doubling time. We have left aside, however, in the earlier discussion, the possibility that the extent of increase in doubling time may have been masked in the case of several other countries because the ramping up of scale of testing increased the confirmed cases faster than the actual increase in the spread (an effect which would be much less in India).
.
Variations Among States
The lockdown and other containment measures taken are at the national level. They are the same essentially for all states and applicable on all uniformly. However, the all-India picture that is generally focused on ignores the very wide variations in what has happened across the country.
.
Even when the Health Ministry put out a list of states with above average doubling times, the range between states was extremely wide – from 8.5 in Delhi’s case to 72 days for Kerala. This list did not include the three states of Maharashtra, Gujarat and Madhya Pradesh. These states were also missing from the list put out by the same Ministry a few days earlier of states with a high proportion of cases originated in the Nizamuddin Tablighi Jamaat congregation – and the numbers in those high proportion states in turn also accounted for most of the nationwide total of cases related to that event. Yet Maharashtra, Gujarat and Madhya Pradesh all share a set of common features. They accounted for 18.4, 6.7 and 1.5 per cent respectively of the nationwide total of confirmed cases on 24th March, the eve of the lockdown. A month later their shares in the nationwide totals have increased to 27.9, 11.4 and 7.4 per cent respectively – meaning that their combined share increased from 26.6 per cent to 46.6 per cent. All of them, however, also have lower shares in the number of recoveries from the infection – their combined total accounting for only 27.4 per cent of the India total. On the other hand, they have a more than proportionate share in deaths–together accounting for as much as 66.6 per cent of all coronavirus related fatalities in the country. Each of them also has a much higher positive confirmation ratio than the national average.
.
Three other states Delhi, Rajasthan, and Tamil Nadu accounting for a large share of confirmed cases in the country (combined share of 26.1 per cent) have lower proportions in fatalities than in confirmed cases. Tamil Nadu and Delhi have a higher share in recoveries while Tamil Nadu and Rajasthan have positive test ratios way below the national average. At the other end of the spectrum is Kerala which had the highest number of cases on 24 March but has since been left behind by several states. A large proportion of its cases have also recovered, while only two have died, so that there has been a distinct and sustained decline in the number of active cases in that state. An arresting or decline in number of active cases is now becoming visible in some states – Delhi, Tamil Nadu, Karnataka and Haryana for instance. In large parts of Eastern and North East India except West Bengal, in the hill states of Uttarakhand and Himachal, and in Goa and Puducherry, the number of infected people never even really took off. Instead of any sustained growth they saw occasional spikes, and their numbers of confirmed cases and deaths have remained at low levels throughout.
.
What is the explanation for these wide variations across the country when essentially the same basic strategy has been in force everywhere? What explains variations within states too – why do a few cities completely dominate the state picture in many cases, particularly those with high numbers? If one goes down to district levels too there are variations – while around 25 of the 736 districts in India account for 60 per cent of the confirmed cases, around 300 have reported no case at all. Surely therefore there are several factors other than the lockdown and containment measures in force in determining the trends in the same period of time – knowing which should be important for formulating the future course of action. A focus on the ‘national’ achievement and the politics played around that only serves to conceal the full picture of what is happening in this vast territory and of the measures that they should call forth.
.
Conclusion
The statistical evidence available so far can be juggled in different ways to suit different interpretations of India’s national level achievements in the battle against the Coronavirus pandemic and may also not be able to capture the full story of the entire country. This is true even if do not consider the economic costs that have had to be paid for these achievements. This is not to say that nothing has been achieved or to belittle the efforts that so many have contributed to – which includes of course the active efforts of frontline workers and local administrations but also the sacrifice in terms of increased hardship so many have borne while willingly implementing the lockdown. The real issue is whether these efforts are being adequately supported and complemented by the Government with resources and with a clear- cut plan. Projecting a success story on the basis of the aggregative statistical trends of infections alone, however, can only take us up to a point in answering the questions about the role of the policy thus far, and tells us even less on what needs to be done now. We still wait, however, for propaganda to be replaced by an open and concrete discussion about what lies ahead, based on the proper application of appropriate scientific expertise to the statistical evidence and not on narrow political calculation.
.
The author is Professor at CESP, JNU, New Delhi