p.p1 {margin: 0.0px 0.0px 0.0px 0.0px; text-align: center; font: 12.0px ‘Trebuchet MS’; -webkit-text-stroke: #000000}
p.p2 {margin: 0.0px 0.0px 6.0px 0.0px; text-align: center; font: 12.0px ‘Trebuchet MS’; -webkit-text-stroke: #000000}
p.p3 {margin: 0.0px 0.0px 6.0px 0.0px; text-align: justify; font: 11.0px ‘Trebuchet MS’; -webkit-text-stroke: #000000}
p.p4 {margin: 0.0px 0.0px 6.0px 0.0px; text-align: justify; font: 12.0px ‘Trebuchet MS’; -webkit-text-stroke: #000000}
p.p5 {margin: 0.0px 0.0px 10.0px 0.0px; font: 12.0px ‘Trebuchet MS’; -webkit-text-stroke: #000000}
p.p6 {margin: 0.0px 0.0px 6.0px 0.0px; text-align: justify; font: 11.0px ‘Trebuchet MS’; -webkit-text-stroke: #000000; min-height: 12.0px}
p.p7 {margin: 0.0px 0.0px 6.0px 0.0px; text-align: justify; font: 10.0px ‘Trebuchet MS’; -webkit-text-stroke: #000000}
p.p8 {margin: 0.0px 0.0px 0.0px 0.0px; font: 11.0px ‘Trebuchet MS’; -webkit-text-stroke: #000000; min-height: 12.0px}
p.p9 {margin: 0.0px 0.0px 0.0px 0.0px; font: 11.0px ‘Trebuchet MS’; -webkit-text-stroke: #000000}
p.p10 {margin: 0.0px 0.0px 0.0px 0.0px; font: 10.0px ‘Trebuchet MS’; -webkit-text-stroke: #000000}
p.p11 {margin: 0.0px 0.0px 10.0px 0.0px; font: 11.0px ‘Trebuchet MS’; -webkit-text-stroke: #000000}
p.p12 {margin: 0.0px 0.0px 10.0px 0.0px; font: 11.0px ‘Trebuchet MS’; -webkit-text-stroke: #000000; min-height: 12.0px}
p.p13 {margin: 0.0px 0.0px 0.0px 0.0px; text-align: justify; font: 10.0px ‘Trebuchet MS’; -webkit-text-stroke: #000000}
p.p14 {margin: 0.0px 0.0px 12.0px 0.0px; text-align: justify; font: 10.0px ‘Trebuchet MS’; -webkit-text-stroke: #000000}
p.p15 {margin: 0.0px 0.0px 10.0px 0.0px; font: 11.0px ‘Times New Roman’; -webkit-text-stroke: #000000}
p.p16 {margin: 0.0px 0.0px 0.0px 0.0px; text-align: justify; font: 8.0px ‘Times New Roman’; -webkit-text-stroke: #000000}
span.s1 {font-kerning: none}
span.s2 {font: 11.0px ‘Trebuchet MS’; font-kerning: none}
span.s3 {font: 6.7px ‘Trebuchet MS’; font-kerning: none}
span.s4 {font: 8.0px ‘Trebuchet MS’; font-kerning: none}
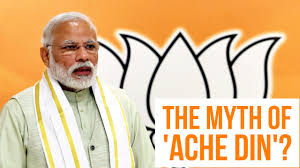
In 2014, the Narendra-Modi led BJP received the special combination of overwhelming support from corporate India and from some sections of the people on the promise of delivering ‘Achhe Din”. Of course, the meaning of this slogan differed across the great economic divide in Indian society that the growth process of the last two and a half odd decades had created. Corporate India sought a revival of the dramatic investment and profit growth that had been witnessed in the boom years that preceded the global crisis – but which had since slowed down considerably, particularly from the beginning of the current decade. For the vast majority of India’s working people, the same slogan evoked no such memories of a rosy past since it never existed. For them, the transition from the boom to slowdown only made worse their already grim economic situation. Reasonable employment and income earning opportunities only became scarcer and the uncertainty associated with them increased. It is a breaking out from this trap that they therefore sought.
The class outlook of big business and international finance, and others whose fortunes had come to be hitched to corporate growth, of course prevented them from acknowledging that their ‘crisis’ was in many ways the outcome of the very same conditions that underlay the earlier boom. Even less were they willing to admit the fact that large scale economic distress was part of this common basis – ensuring a highly elastic cheap labour regime that was exploited to the hilt but in the process also limiting the domestic market and its growth to a narrow segment of the population. The exceptional and near unanimous backing of corporate India for a ‘regime change’ in 2014 did not therefore spring from a desire for any fundamentally new economic programme. On the contrary, what it sought was a political regime that could more decisively facilitate widening of the gap between the ‘inclusion’ in one way and ‘exclusion’ in the other that has been the source and foundation of corporate profitability and accumulation. Cheaper and more flexible labour, lower taxes, shifting of public expenditure priorities to directions (infrastructure) and forms (insurance-based welfare measures) that would be directly profit-enhancing in nature, greater privatization, reduction of constraints on access of private capital to land and other natural resources and on their freedom to inflict environmental damage, writing off debts of capitalists, etc. – these were what made up the wish-list of capitalists. They expected the Modi Government to deliver on these and for these to then unshackle the latent possibilities of a rapid process of accumulation and profit growth.
The Modi government, whose formation was in effect a reassertion by India’s economic elite, was never going to do much more than trying to deliver sops to the people through, and within the limits imposed by, the fostering of a private-capital led process of economic expansion. However, because of the economic limitations of the ‘solution’ itself, and in part due to the political constraints that even this regime has faced in implementing it, continuation of sluggish tendencies that emerged at the beginning of this decade have marked even the 4 years of the Modi-led BJP Government.
Austerity, Oil Prices, Demonetization and GST
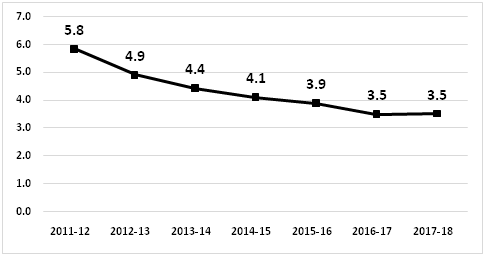
A key element in the continuity was the BJP government’s pursuit of what the UPA-2 government had initiated – namely, a retreat from the limited ‘fiscal stimulus’ announced after the global crisis. The Modi government maintained the pre-occupation with slashing the fiscal deficit (Figure 1), and by curbing public expenditure growth rather than increased revenue mobilization. Yes, demonetization and the introduction of the Goods and Services Tax (GST) were claimed to be the big-ticket measures of the Government to increase tax compliance and unearth black money. The evidence is, however, clear that these have not produced any such effects. Instead, the Government’s revenue situation was propped up by taking advantage of the opportunity offered by the decline in international oil prices from July 2014 to raise more taxes.
Figure 1: Central Government Fiscal Deficit to GDP Ratio (Per cent), 2011-12 to 2017-18
(Source: Reserve Bank of India, Handbook of Statistics on the Indian Economy)
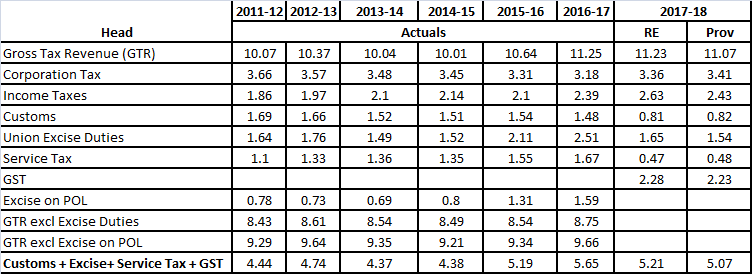
The increase in oil excise duties from November 2014 onward combined with the lapsing of excise duty concessions that had been originally part of the post-crisis fiscal stimulus facilitated higher excise revenues. As can be seen in Table 1, excise duties, particularly those on Petroleum, Oil and Lubricants (POL), were solely responsible for the marginal improvements in the central taxes to GDP ratio in 2015-16 and 2016-17. In fact, oil excise duties accounted for almost 75 per cent of the 1.21 percentage point increase in the Central taxes to GDP ratio between 2013-14 and 2016-17. Even after this, the ratio was well below the pre-stimulus high of 11.89 per cent achieved in 2007-08.
Table 1: Revenues from Central Taxes (as Per cent of GDP), 2011-12 to 2017-18
Note: All figures exclude GST Compensation Cess.
Source: Government of India, Union Budget; Controller General of Accounts, Provisional Union Government Accounts for 2017-18; and CSO, Press Note on Provisional Estimates of Annual National Income, 2017-18.
Figure 2: Revenues from Central Excise Duties and State Sales Tax/VAT on POL Products (Rs. Crores), 2011-12 to 2016-17
Source: Petroleum Planning and Analysis Cell
The heavier taxation on POL products, which of course reduced the extent to which reduction in international prices were passed on to consumers, was also clearly chiefly the handiwork of the Central Government (Figure 2). It’s inability to find alternative sources of revenues has meant that the Modi Government has not been able to reverse significantly the excise duty increases once oil prices started truly firming up from mid-2017. As a result, domestic prices in India are now higher than in 2014. This is even though international oil prices are still less than in July 2014 – by around 25 per cent even after adjusting for the depreciation of the rupee in the interim.
Probably caught up in the hype that his own government created around the demonetization initiated just a few months before the presentation of the Union Budget for 2017-18, the Finance Minister made very ambitious estimates for income-tax revenue growth in 2017-18. By the time the next Budget was presented, on 1 February this year, the data for nearly 10 months was available and indicated clearly that actual income-tax revenues in 2017-18 were going to fall far short of the budget estimates. Surprisingly, but then not so surprisingly, no downward adjustment was made when the Revised Estimates of income tax revenues for 2017-18 were presented along with the Budget Estimates for 2018-19. Corporate income taxes were, however, treated asymmetrically and the revised estimates took into account the fact that corporate tax revenue performance till January 2018 had turned out to be slightly better than what the original budget estimates had assumed. Now that the provisional figures for the year have been released by the Controller General of Accounts on 31 May 2018, the sleight of hand has been caught out – actual income-tax revenues in 2017-18 were over Rs. 33,000 crores below the revised estimates and as a ratio of GDP almost the same as the previous year. The accounts also show that excise duty collections are another Rs. 18,000 crores less than the figures in the Revised Estimates.
The introduction of the Goods and Services Tax (GST) has been touted as India’s biggest tax reform, one of the singular achievements of the Modi Government. Its claims to be an efficient tax notwithstanding, its introduction has had an adverse effect on revenues in 2017-18. This tends to be partly hidden by the fact that the Central Government’s GST revenue figures includes those from the GST compensation cess – specially levied to finance the compensating of state governments for the loss of their revenues. Table 1 therefore excludes the revenues from GST compensation cess to present a clearer picture. Since GST was introduced from 1 July 2017, and replaced some of the other indirect taxes, the effect it had on Central Government revenues can only be gauged by comparing the total revenue from such indirect taxes in 2016-17 with the figure in 2017-18 inclusive of GST. The last row of Table 1 allows for such a comparison of the combined revenues from Customs, Excise, Service Tax and GST. What emerges is that their ratio to GDP dropped from 5.65 per cent in 2016-17 to 5.07 per cent in the provisional accounts for 2017-18. This then is the GST effect!
Thus, the two ‘great’ measures of the Modi government to unearth black money and curb tax evasion have so far proved to be all pain with no gain. The pain of high oil prices in addition has been now inflicted on the people to hold up sagging revenues. Despite that, the revised estimates for central tax revenues (excluding GST cess) were already below the budget estimates and the provisional figures are another Rs. 28,000 crores less. The small difference between the tax-GDP ratio in 2017-18 compared to 2013-14 (the last full year of UPA-2) has not only been more reliant on indirect rather than direct taxes. It has been also almost completely neutralized by the parallel reduction in the fiscal deficit. Thus, 4 years down the line the expansionary push to the economy coming from the Central Government’s fiscal measures is certainly no more than what it was in the previous regime.
Persistence of Slowdown and Deepening Agrarian Distress
Agricultural production in the last four years (2014-15 to 2017-18) does not compare very favourably with that in the previous four years (Table 2). Indian agriculture’s output of foodgrains in the four-year period ending in 2017-18 was barely 3 per cent greater than the period of the same duration ending in 2013-14, and mainly due to an exceptional growth in production of pulses. Non-foodgrain crops, on the other hand, suffered a fall in production in the 4 years of the present government.
Table 2: Agricultural Production (in Million tonnes), 2010-11 to 2013-14 and 2014-15 to 2017-18
Note: 2017-18 figures are Advance Estimates
Source: 3nd Advance Estimates of Production for 2017-18, Agricultural Statistics Division, Directorate of Economics & Statistics, Ministry of Agriculture, Cooperation and Farmers’ Welfare
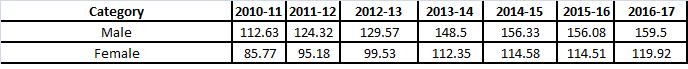
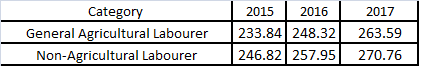
If agriculture and farm incomes have suffered due to poor production in some years, they have also been hit by poor price realizations in what were production-wise better years. The hit taken by the rural economy is most clearly expressed in the return of stagnation in rural wages. Table 3 shows that the upward trend in these wages that had emerged from 2008 after a previous long period of stagnation has tapered off since 2014-15. Further confirmation is provided by the information provided in reply to a Parliament question which is summarized in Table 4. According to this, the increases in the nominal annual average daily wage rates in rural India, have just kept pace with inflation. These are also daily rates and may not capture the fact that even the number of days that work is available have come down. Almost or more than five crore rural households have annually sought work under the MNREGA in the four years of the current government. This is despite daily wage rates under the Scheme being around 100 rupees less than the market rate (in 2017-18 the MNREGA average annual daily wage rate per person was Rs. 169.46).
Table 3 Real wage rates for unskilled labour occupations in rural India (in Rupees)
Note; CPI-RL (2009–10¼100) used as a deflator
Source: Arindam Das and Yoshifumi Usami, Wage Rates in Rural India, 1998–99 to 2016–17 Review of Agrarian Studies vol. 7, no. 2, July–December 2017
Table 4: Nominal Annual Average Daily Wage Rates in Rural India (Rupees)
Source: PIB Release 5 March 2018
Apart from agriculture, the industrial and construction sectors have also continued to be laggard sectors in the 4 years of BJP rule. The growth of the real estate sector has been, like everywhere else in the world, an integral element of the neo-liberal growth trajectory. In addition has been the impetus neo-liberalism has given to the building of infrastructure through the agency of private business. In India these spurred a rapid growth of construction activities from the second half of the-1990s, which accelerated after the turn of the century. Construction also became the most important employment outlet for those leaving agriculture. The sector has, however, been doing poorly since the beginning of the current decade, has become a major source of the Non-Performing Assets (NPA) problem of banks – and there has been no significant change in this scenario in the last four years (Figure 3).
Figure 3: Growth of Construction GDP, 1997-98 to 2017-18 (Per cent per annum)
Note: Growth rate up to 2011-12 derived from the old (2004-05 base year) series and thereafter from the new (2011-12 base year) series.
Source: Central Statistical Organization, Government of India: National Accounts Statistics
The real story of Indian industry tends to be obscured in the GDP data of the CSO’s new series. The persistence of industrial stagnation is, however, confirmed by the new series of the Index of industrial Production (IIP) Indian industry issued by the same organization and introduced after the new GDP series was started, with the same base year (Table 5). Here again, the Modi ‘magic’ seems to have produced no visible turnaround.
Table 5: Annual Growth of the Index of Industrial Production (2011-12=100), 2012-13 to 2017-18 (Percentage Increase in Annual Averages over the previous year)
Source: Central Statistical Organization, Government of India
Industrial stagnation in itself indicates the failure of programmes like ‘Make in India’ which were announced with great fanfare. Trends in India’s foreign trade not only reinforce the picture of Make in India floundering – they in fact suggest that an unannounced ‘Make for India’ programme seems to be doing better! If we leave out the oil trade, Figure 4 shows that non-oil exports have simply refused to grow over the tenure of the present government even as imports have started increasing. The non-oil trade deficit in 2017-18 has grown to more than twice the level in 2013-14, even as the advantage of low oil prices is receding. So much then for ‘export-led growth’.
Figure 4 India’s Non-Oil Foreign Trade (US $ Million), 2014-14 to 2017-18
Source: Reserve Bank of India, Handbook of Statistics on the Indian Economy
From the point of view India’s external balances, what is additionally worrying is that services export growth has been slowing down. The surplus in India’s trade in this category has also begun to decline or stagnate and has done poorly in the last four years (Figure 5).
Figure 5: India’s Net Position in Services Trade (US $ Million), 2011-12 to 2017-18
Source: Reserve Bank of India, Handbook of Statistics on the Indian Economy
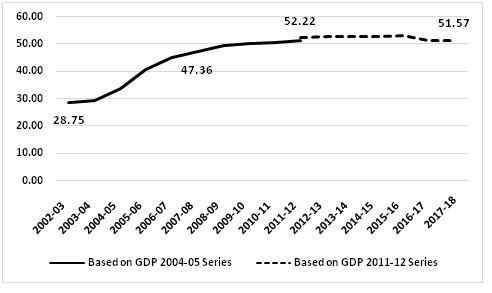
Given the situation in construction, manufacturing and on the export front, it wouldn’t be surprising if the investment sluggishness that had set in long before 2014 also persisted during the four years of the Modi regime. National Accounts data unambiguously confirmed this until very recently, when revisions in the GDP estimates suddenly raised the growth rate of real Gross Fixed Capital Formation (GFCF) for 2016-17 from 2.4 per cent to 10.1 per cent and for 2017-18 from 4.5 per cent to 7.6 per cent. Despite such mysterious revisions, it remains true that the investment ratio (Gross Fixed Capital Formation to GDP) has been lowered from where it was at the beginning of the tenure of the BJP Government. Moreover, there is no sign that the downward trend in the investment-ratio is reversing again and returning towards repeating the very dramatic rise it had experienced during the pre-2008 boom (Figure 6).
Figure 6 Gross Fixed Capital Formation to GDP at Current Prices (Per cent), 2002-03 to 2017-18
Note: FAA = First Advanced Estimates
Source: Central Statistical Organization, Government of India: National Accounts Statistics
In addition to the continuing slow growth of construction, there is other evidence that investment growth has not revived under BJP rule. Trends in domestic production of capital goods as well as of their imports indicate that capitalists are not spending more and more on capital formation. Table 6 shows that capital goods production in India has throughout this decade languish at close to the 2011-12 level. including in the last four years. Likewise, the evidence on quantity of capital goods imported shows that there has been no recovery from the collapse that happened at the beginning of the decade (Figure 7).
Table 6: Index of Industrial Production (2011-12 = 100) for Capital Goods, Annual Average Values, 2011-12 to 2017-18
Source: Central Statistical Organization, Government of India
Figure 7: Quantum Index of Imports of Machinery and Transport Equipment (1999=100), 2001-02 to 2016-17
Source: Reserve Bank of India, Handbook of Statistics on the Indian Economy
Figure 8: Ratio of Bank Credit to GDP, 2002-03 to 2017-18
Finally, the trends in bank credit also reaffirm the absence of any investment revival (Figure 8). Bank credit had grown rapidly during the pre-global crisis boom. The current decade, including very much the 4-year period of Modi’s Prime Ministership, has, however, been marked by a sharp slowdown in credit growth.
If anyone representing any segment or class of Indian society had any expectation that the 2014 election result would spark off a dramatic transformation of their economic fortunes, there is every reason for them to be deeply disappointed. There have been concerted attempts at providing a “friendly” climate for private capital and investment, though combined with disruptive actions like demonetization and banning of the cattle trade. These have, however, failed to entice capitalists to invest and make the accumulation process take off. While they are mostly incapable of expressing it in words, capitalists have in this way passed a scathing judgement on their own handiwork and on their dream government. In the absence of any such take-off of accumulation, the terribly imperfect and yet almost the only mechanism of generating employment that the Government promoted could not have worked. It also meant revenue expansion could not be generated on a scale which would permit reconciling significant increases in public expenditure with the objective of curbing the fiscal deficit.
The Government’s formal and informal propaganda machine will of course roll out figures of GDP growth, number of beneficiaries of multiple schemes, and of the lowered inflation rates, etc. However, the bottom-lines of corporate India and the state of their ‘animal spirits’ on the one hand, and the precarious state of the household economies of India’s working millions, will tell each of them a different story. In between them lie smaller businesses and traders particularly hit by demonetization and GST. If we add to the picture everything else that the BJP government has done or encouraged, ‘Achhe Din’ looks even more distant now than 4 years ago.
The author is Professor of Economics in Jawaharlal Nehru University, New Delhi